Ground motion of Hungary
National ground motion map and building-level motion history database (v20250312)
Based on 265 dates between 2014 and 2024, covering 23 million objects
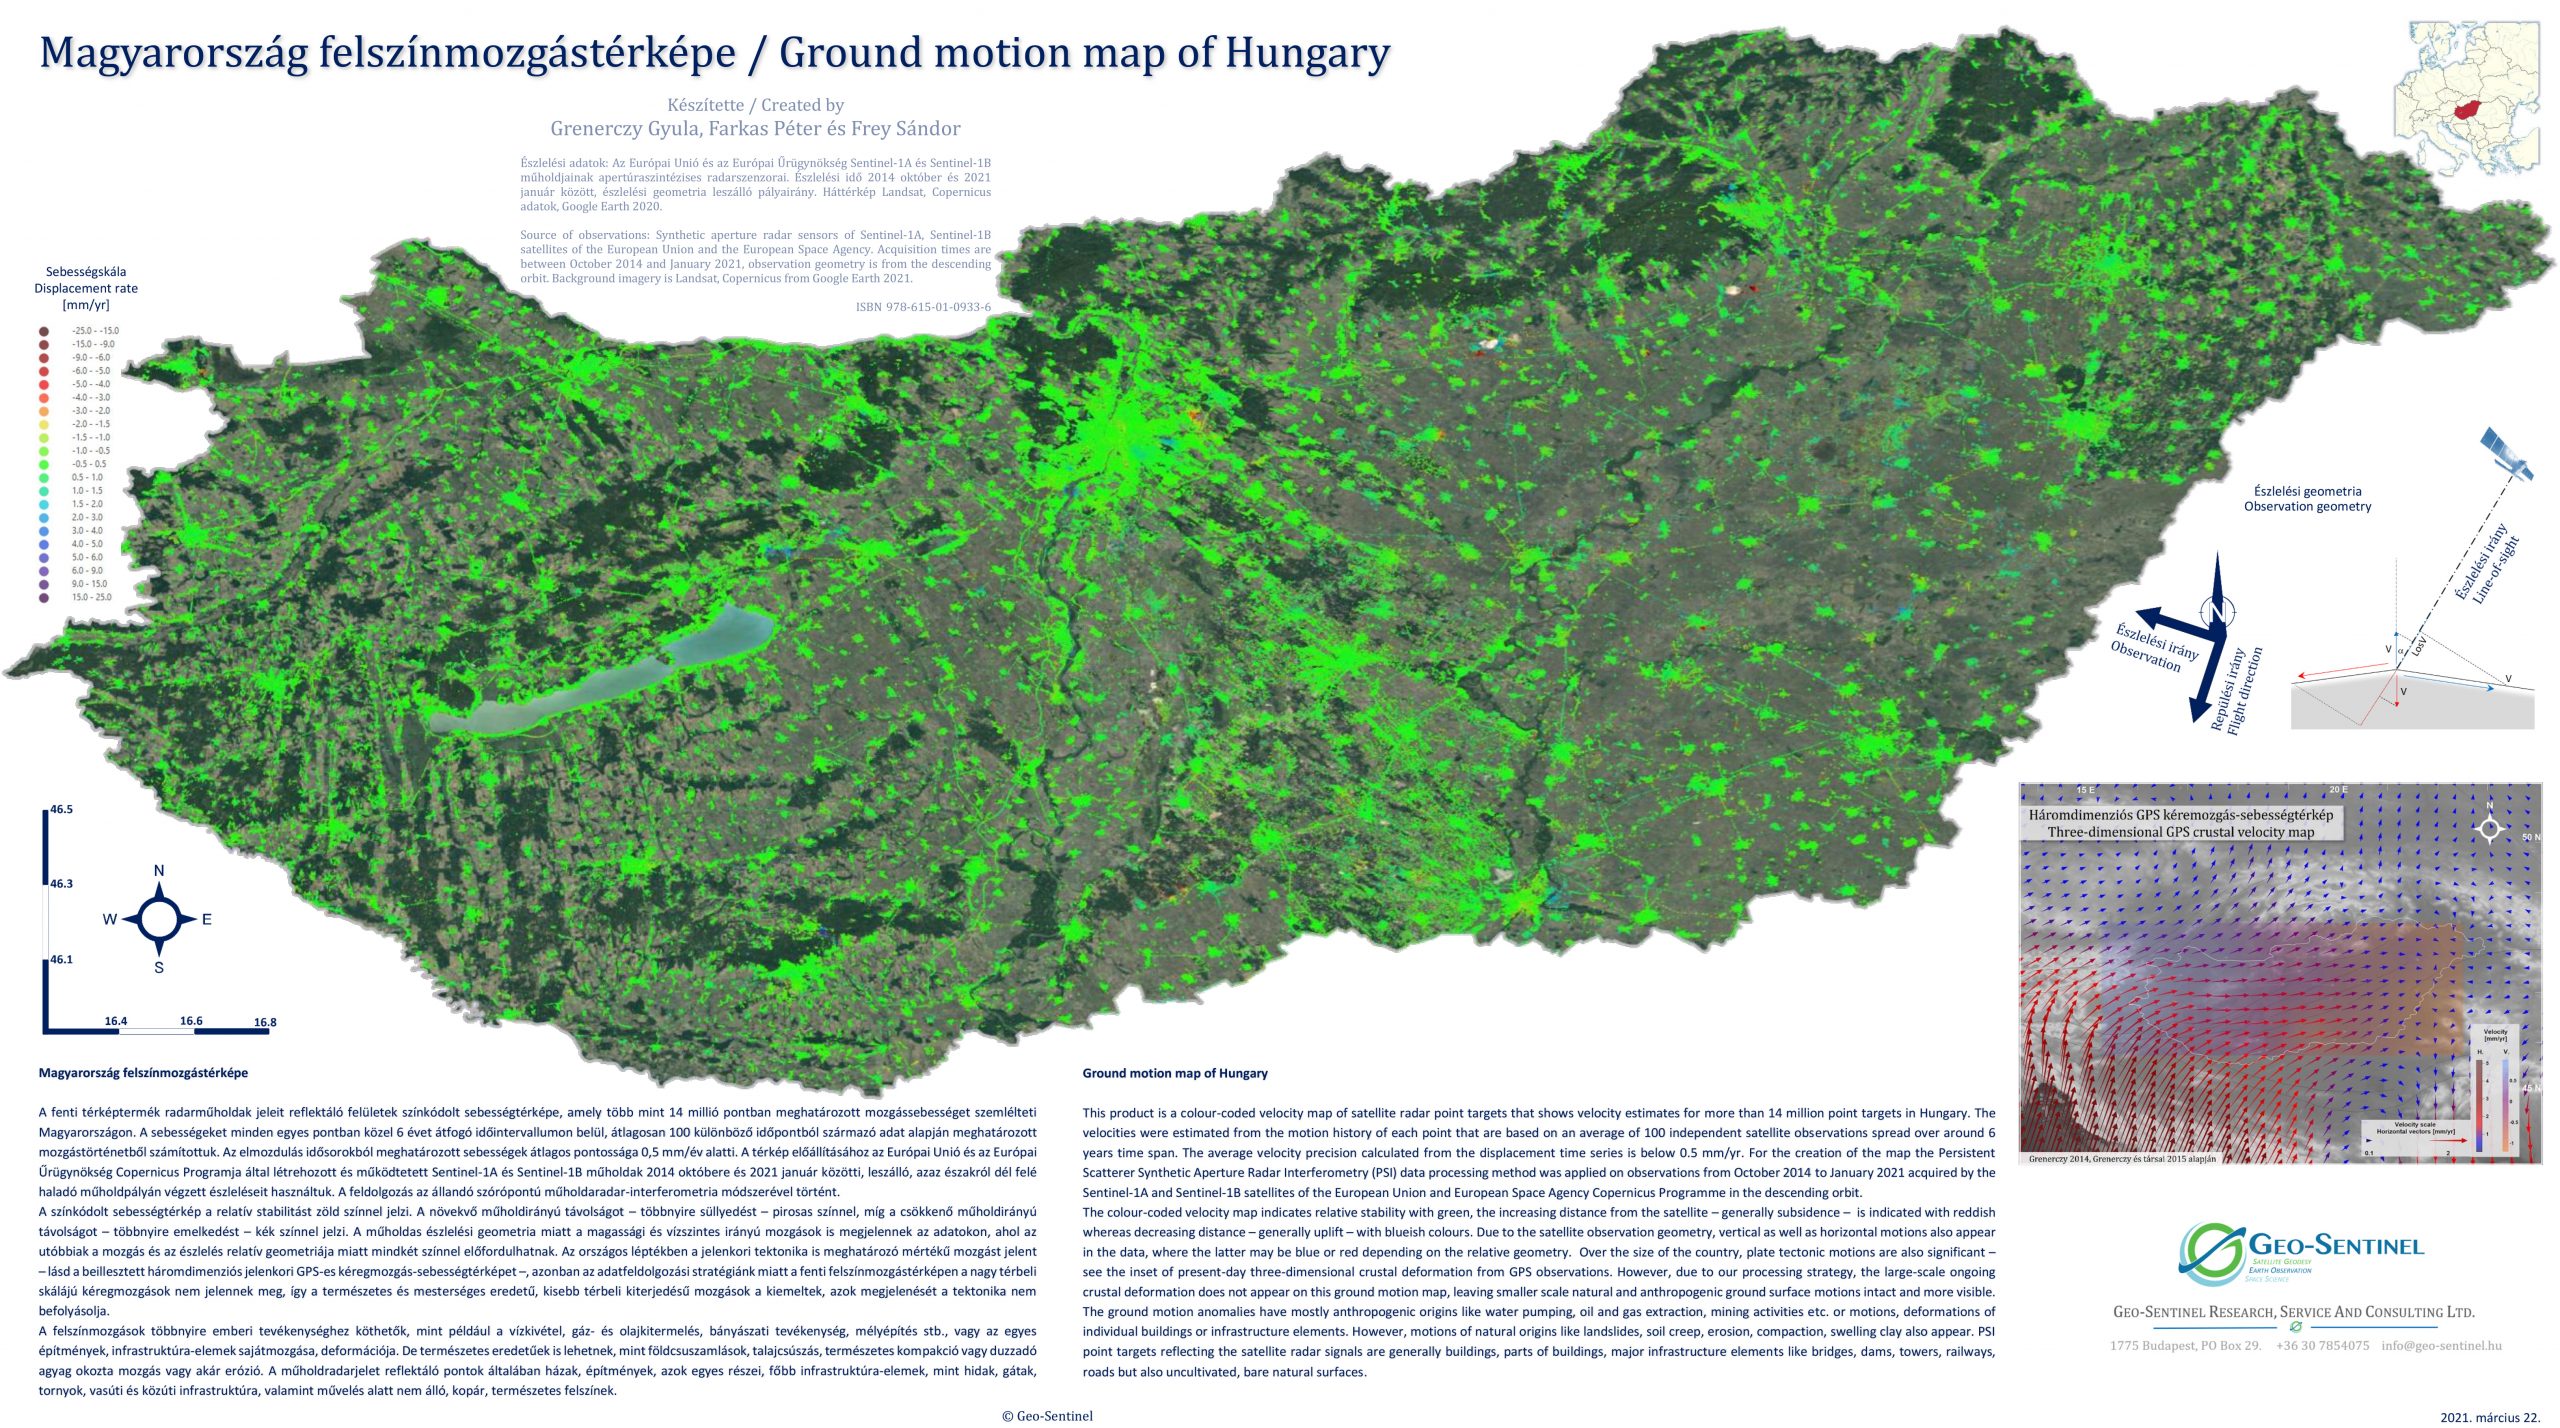
Geo-Sentinel developed a national ground motion monitoring system and created Hungary's first high-resolution ground motion map and motion history database in 2020, which has been updated and extended again in 2025. The Ground Motion Map of Hungary now covers one decade of motion history over the entire country. The latest version of the map can be downloaded by clicking on the image below or at the bottom of the page.
Geo-Sentinel’s upgraded Ground Motion Map of Hungary now includes velocity estimates for more than 23 million point targets in the country. The average velocities were calculated from the motion history of each point and are based on an average of 265 independent satellite observations spread over around 10 years’ time span. The average velocity precision calculated from the displacement time series is below 0.2 mm/yr. For the creation of the map, the Persistent Scatterer Synthethic Aperture Radar Interferometry (PSI) data processing method was applied on all observations from October 2014 to August 2024 acquired by the Sentinel-1A satellite of the European Union and European Space Agency Copernicus Programme in the descending orbit.
The colour-coded velocity map indicates relative stability with green, the increasing distance from the satellite – generally subsidence – is indicated with reddish whereas decreasing distance – generally uplift – with blueish colours. Due to the satellite observation geometry, vertical as well as horizontal motions also appear in the data, where the latter may be blue or red depending on the relative geometry. Over the size of the country, plate tectonic motions are also significant – see the inset of present-day three-dimensional crustal deformation from GPS observations. However, due to our processing strategy, the large-scale ongoing crustal deformation does not appear on this ground motion map, leaving smaller-scale natural and anthropogenic ground surface motions intact and more visible.
The ground motion anomalies have mostly anthropogenic origins like water pumping, oil and gas extraction, mining activities, etc., or motions, deformations of individual buildings or infrastructure elements. However, motions of natural origins like landslides, soil creep, erosion, compaction, swelling clay also appear. PSI point targets reflecting the satellite radar signals are generally buildings, parts of buildings, major infrastructure elements like bridges, dams, towers, railways, roads but also uncultivated, bare natural surfaces.
To learn more about the movement or stability of your property, industrial site or municipality, contact us and discover how our high-precision, high spatial and high temporal resolution analyses can support your company's strategic decisions or the success of your research projects. The reliability and details of our data will allow you to obtain a more accurate picture of environmental changes and their impacts, giving you a competitive advantage to make more informed decisions. Our geophysics and space research experts have over 30 years of professional experience and in-depth knowledge of all aspects of motion analysis, and to provide you with informed support for your decisions.
Related links:
- Ground motion map of Hungary (v20250312) in PDF
- Ground motion map of Hungary (v20210322) in PDF
- Ground motion map of Hungary (v20201019) in PDF
- Ground motion small atlas of Hungary in PDF
- Citable document (DOI: 10.5281/zenodo.4108589)
- How does the Hungarian capital Budapest move? (Geo-Sentinel, July 2017)

