
How does the Hungarian capital Budapest move?
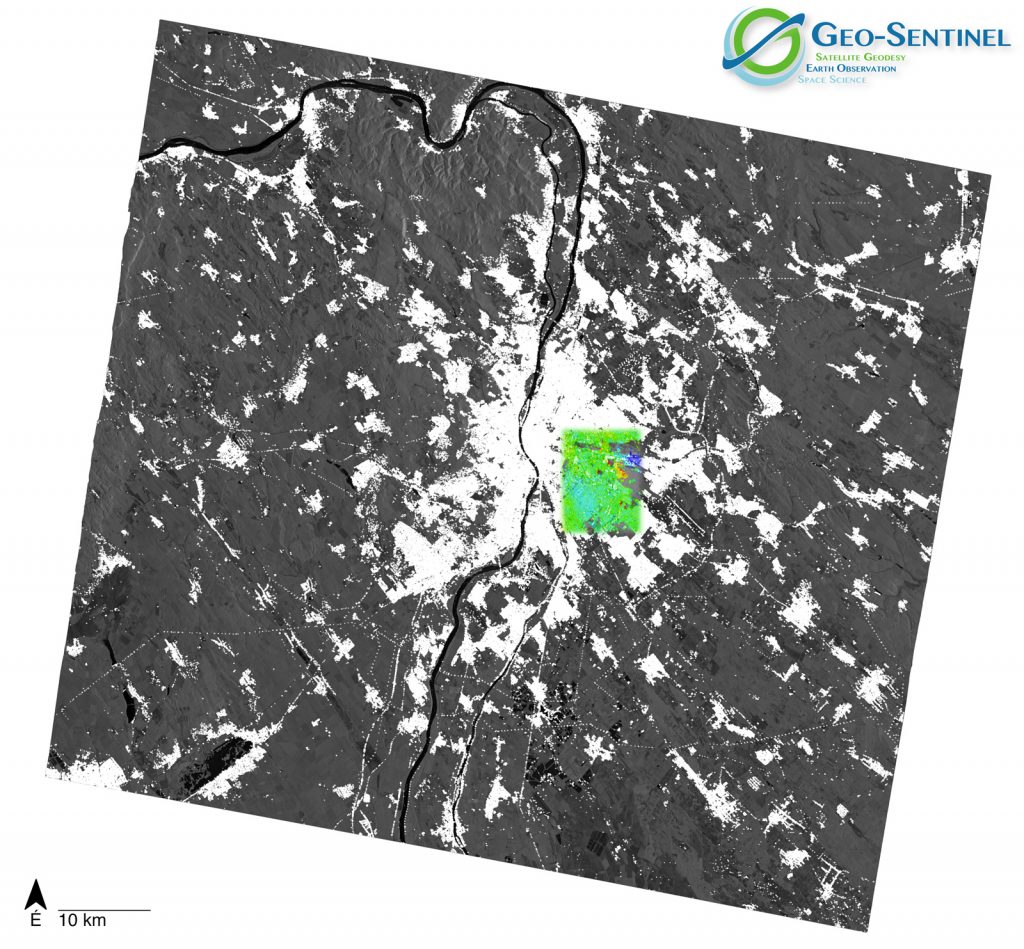
How did the surface and buildings move in the past 2.5 years in Budapest, Hungary and its surroundings? We have the answer for almost 1.5 million points in an area covering nearly 7000 square kilometres.
We have created the first Sentinel-1 based permanent scatterer interferometric analysis of the greater Budapest region. By thorough and complex processing of a total of 80 satellite acquisitions during the period since October 2014, the mostly vertical motion of our environment is mapped out in unprecedented detail.
The largest and most extended anomaly in Budapest and its surroundings, the Kőbánya uplift with velocities up to 1 cm/year was detected by earlier interferometric synthetic aperture radar (InSAR) measurements and ground-based validation. This anomaly was caused by the termination of local water pumping that had been present in the second half of the past century and consequently the rising water table in the past decades. Our results based on Sentinel-1 data processing clearly show that the extensive uplift at this region slowed down and stabilized, only up to 2 mm/year uplift remained at the south-western part of the anomaly.
Temporal evolution of the uplift of Kőbánya district, Budapest, based on Sentinel-1 and earlier satellite interferometric SAR data. (Animation: Geo-Sentinel Ltd, data and processing: Terrafirma 1995-2006, Copernicus Sentinel / Geo-Sentinel Ltd 2014-2017, background: Google Earth)
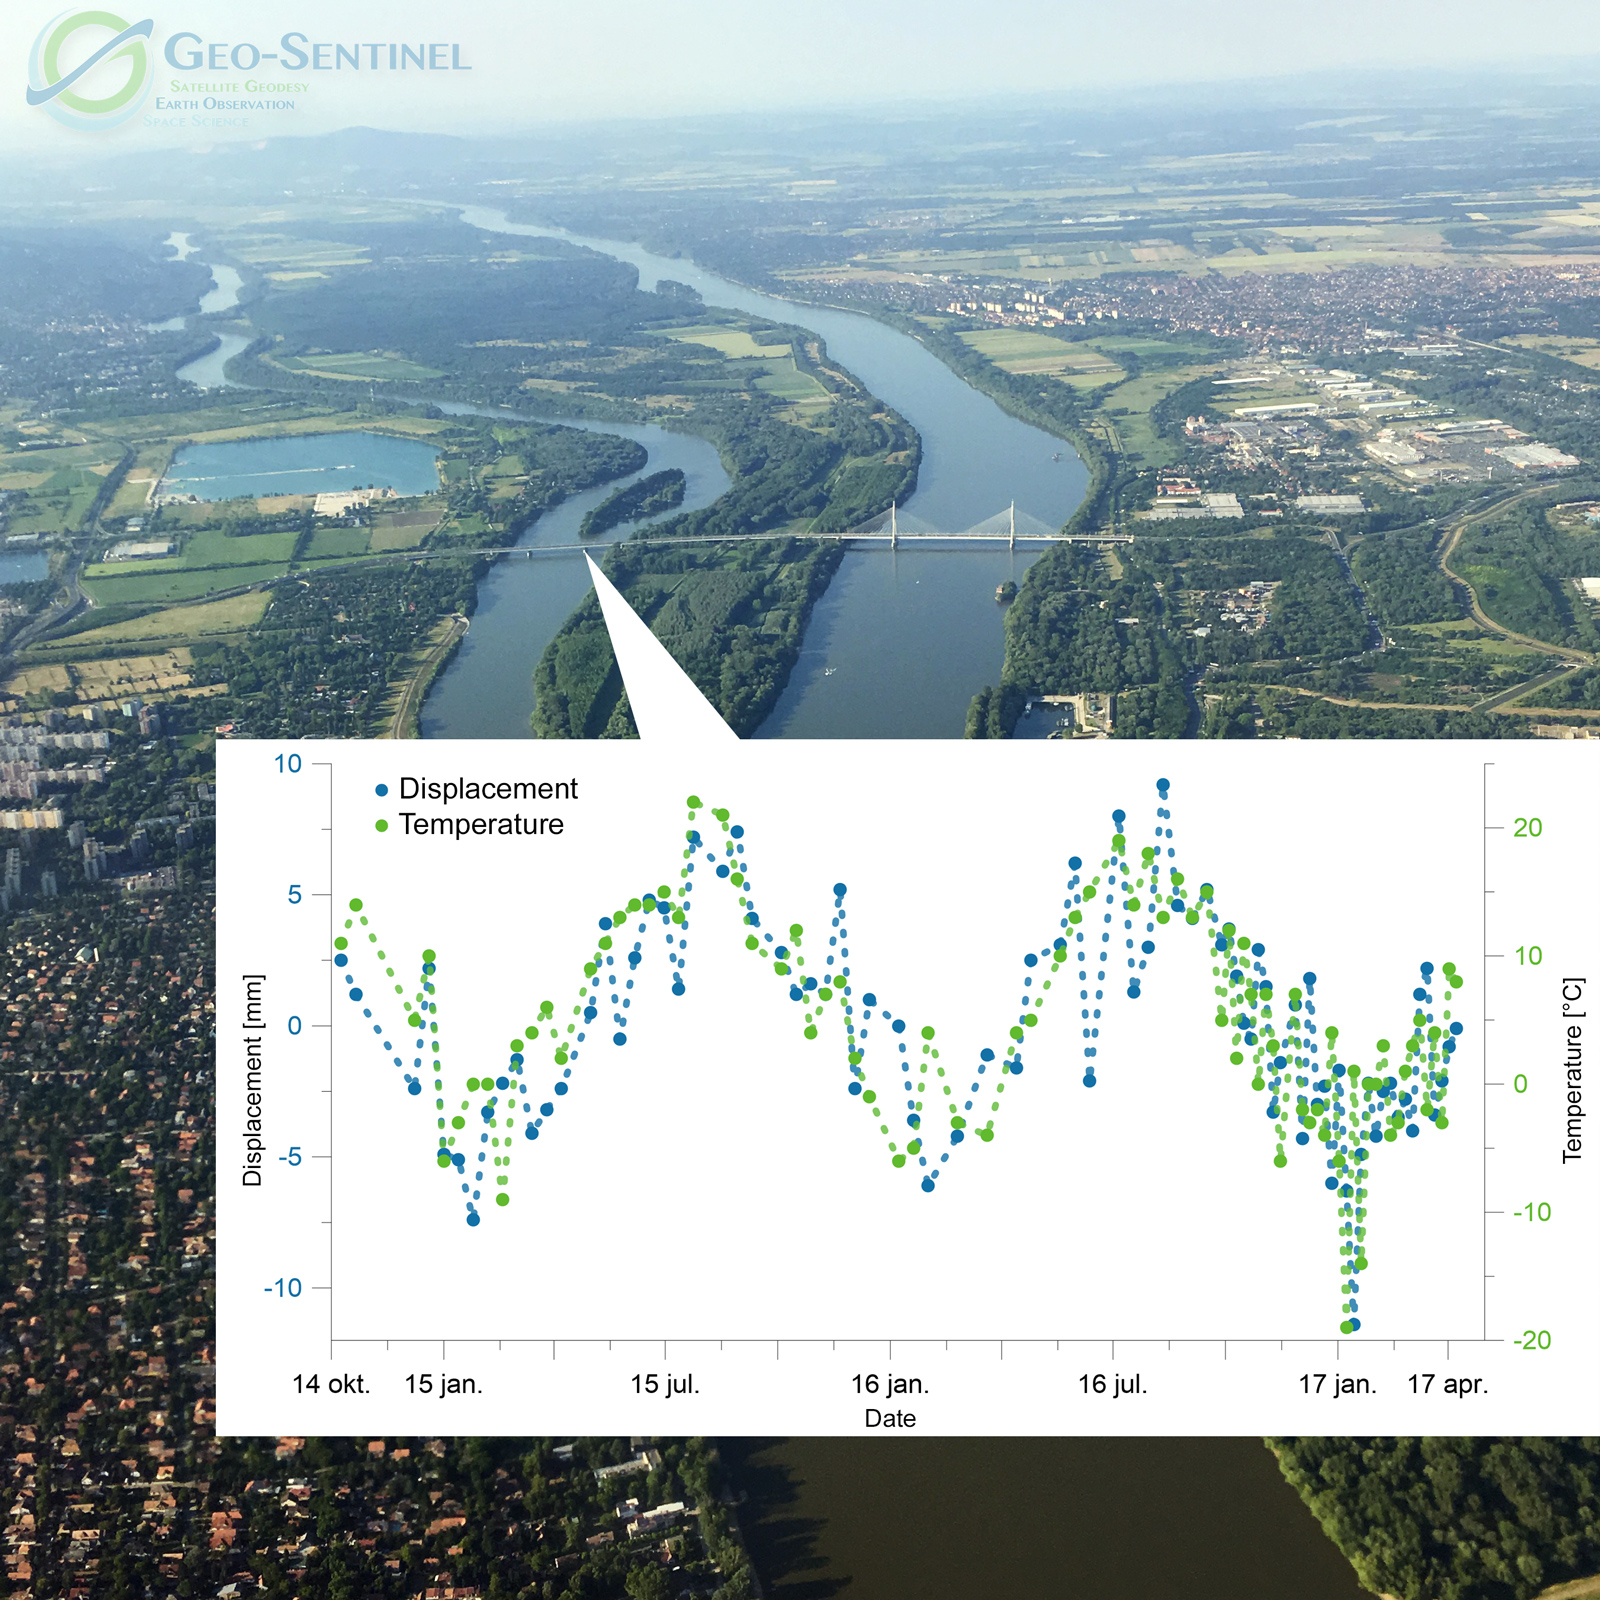
The achievable accuracy using interferometric SAR is well demonstrated by the case of Megyeri bridge, where a seasonal signal with an amplitude of 1 cm/year can be detected in the line-of-sight motion of certain parts of the bridge. It is clearly correlated with the changes in temperature. With this satellite technique, even small deformations of the bridge structure caused by thermal expansion can be measured.

Acquisitions of Sentinel-1 satellites are going to continue for a long time. As time progresses, a more accurate determination of the motion history will be possible. These data may be important for e.g. mining, oil and water industry experts, operators of major facilities, utilities and road constructors, civil engineers, real estate developers, insurance companies, local governments and anyone else who find the knowledge of motion or stability of surface and buildings useful or interesting.
The results above were first presented at the Fringe 2017 conference in Helsinki, Finland. The Hungarian version of this text is available here in the Sentinel blog.